Abstract
Context. The detection and identification of oscillation modes (in terms of their l, m, and successive n) is a great challenge for present and future asteroseismic space missions. “Peak tagging" is an important step in the analysis of these data to provide estimations of stellar oscillation mode parameters, i.e., frequencies, rotation rates, and further studies on the stellar structure.
Aims. Our goal is to increase the signal-to-noise ratio of the asteroseismic spectra computed from the time series that are representative of MOST and CoRoT observations (30- and 150-day observations).
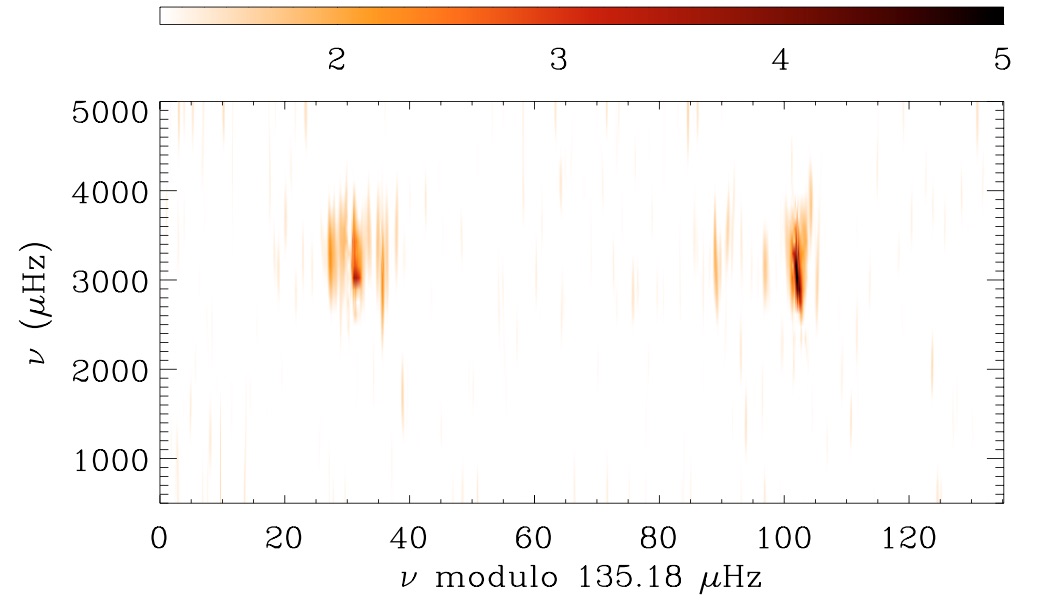
Methods. We apply the curvelet transform – a recent image processing technique that looks for curved patterns – to echelle diagrams built using asteroseismic power spectra. In the resulting diagram, the eigenfrequencies appear as smooth continuous ridges. To test the method, we use Monte-Carlo simulations of several sun-like stars with different combinations of rotation rates, rotation-axis inclination, and signal-to-noise ratios.
Results. The filtered diagrams enhance the contrast between the ridges of the modes and the background, allowing a better tagging of the modes and a better extraction of some stellar parameters. Monte-Carlo simulations have also shown that the region where modes can be detected is enlarged at lower and higher frequencies compared to the raw spectra. In addition, the extraction of the mean rotational splitting from modes at low frequency can be done more easily using the filtered spectra rather than the raw spectra.

