Abstract
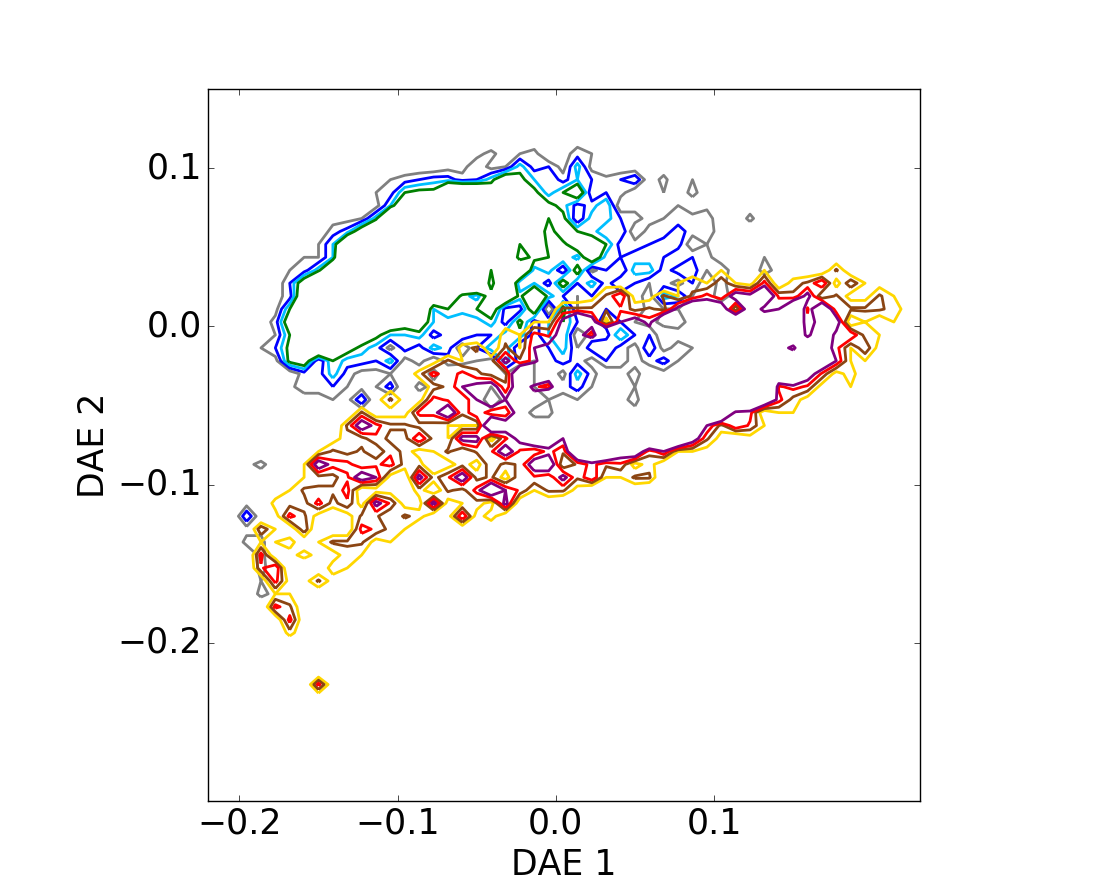
With the increasing number of deep multi-wavelength galaxy surveys, the spectral energy distribution (SED) of galaxies has become an invaluable tool for studying the formation of their structures and their evolution. In this context, standard analysis relies on simple spectro-photometric selection criteria based on a few SED colors. If this fully supervised classification already yielded clear achievements, it is not optimal to extract relevant information from the data. In this article, we propose to employ very recent advances in machine learning, and more precisely in feature learning, to derive a data-driven diagram. We show that the proposed approach based on denoising autoencoders recovers the bi-modality in the galaxy population in an unsupervised manner, without using any prior knowledge on galaxy SED classification. This technique has been compared to principal component analysis (PCA) and to standard color/color representations. In addition, preliminary results illustrate that this enables the capturing of extra physically meaningful information, such as redshift dependence, galaxy mass evolution and variation over the specific star formation rate. PCA also results in an unsupervised representation with physical properties, such as mass and sSFR, although this representation separates out less other characteristics (bimodality, redshift evolution) than denoising autoencoders.


