Abstract
Weak-lensing peak counts has been shown to be a powerful tool for cosmology. It provides non-Gaussian information of large scale structures, complementary to second order statistics. We propose a new flexible method to predict weak lensing peak counts, which can be adapted to realistic scenarios, such as a real source distribution, intrinsic galaxy alignment, mask effects, photo-z errors from surveys, etc. The new model is also suitable for applying the tomography technique and non-linear filters. A probabilistic approach to model peak counts is presented. First, we sample halos from a mass function. Second, we assign them NFW profiles. Third, we place those halos randomly on the field of view. The creation of these "fast simulations" requires much less computing time compared to N-body runs. Then, we perform ray-tracing through these fast simulation boxes and select peaks from weak-lensing maps to predict peak number counts. The computation is achieved by our \textsc{Camelus} algorithm, which we make available at this http URL. We compare our results to N-body simulations to validate our model. We find that our approach is in good agreement with full N-body runs. We show that the lensing signal dominates shape noise and Poisson noise for peaks with SNR between 4 and 6. Also, counts from the same SNR range are sensitive to Ω
Summary
A new, probabilistic model for weak-lensing peak counts is being proposed in this first paper of a series of three. The model is based on drawing halos from the mass function and, via ray-tracing, generating weak-lensing maps to count peaks. These simulated maps can directly be compared to observations, making this a forward-modelling approach of the cluster mass function, in contrast to many other traditional methods using cluster probes such as X-ray, optical richness, or SZ observations.
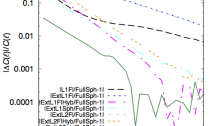
The model prediction is in very good agreement with N-body simulations.
It is very flexible, and can potentially include astrophysical and observational effects, such as intrinsic alignment, halo triaxiality, masking, photo-z errors, etc. Moreover, the pdf of the number of peaks can be output by the model, allowing for a very general likelihood calculation, without e.g. assuming a Gaussian distribution of the observables.


